
Benjamin Franklin’s axiom, “An ounce of prevention is worth a pound of cure”, has been used most commonly when referring to health care. It is also highly appropriate in reliability and maintenance circles.
Of course, we complicate it in business by wanting to know what the prevention will cost and what we save by avoiding the cost of the cure.
In the reliability world, we know that effective maintenance practices and high reliability will be beneficial to our companies. Yet, most M&R (Maintenance & Reliability) practitioners cannot articulate the financial value of the work done, nor explain just what financial benefits can be achieved by doing it. We often need to dig to find costs. Benefits are not tracked in accounting systems either – savings cost you don’t spend, and therefore you don’t account for them. Increased revenues are accounted for, but attributing them to specific improvements, especially if many are being undertaken, is a challenge that few are willing to tackle.
Even though we know there will be benefits from doing the right things, these days we need to justify by showing a return on the investment of those improvement costs. We were recently asked by a client to show them how we would measure value delivered by their improvement program in maintenance and reliability. They wanted to assure themselves that they were spending their money wisely.
Key Performance Indicators
We could have shown them an array of key performance indicators (KPIs), but those are mostly about process, and wouldn’t have shown the relationships between actions and results. If we consider reliability and maintenance to be a process (or functional group of processes) we can model it simply as: input à process à output.
- Inputs are what we spend money on – energy, labor, services, and materials.
- Outputs are what we get out of the process – the results are increased uptime, reliability, and availability resulting in increased production/service delivery and increased Revenue. It also lowers risk and supports safety and environmental compliance.
- The process uses the inputs to deliver the outputs. In reliability, there are many processes and M&R practitioners tend to get wrapped up in their details. We have work management, planning, scheduling, supervision, skills development, contracting, outsourcing, materials provision, stores, inventory management, root cause analysis, reliability-centered maintenance, etc. Many specialize in one or more of these various sub-processes.
To complicate it further, we also have various IT systems to help us with transactions (work orders, purchasing, store issues, returns, etc.), processes (RCFA and RCM), and measuring what we do in all our processes and as individuals. Those are, “Key Performance Indicators” (KPIs). Those systems are like scoreboards in sports. The teams do all the work and score the goals. The score-board only records the various statistical indicators and relative scores. On its own, it adds no value, if it changes nothing.
With all that complexity, most of it requires some form of investment, where does a company put its money and where does it see the best payback? To explain that we created the following graphic. It shows what work would be executed and where it would contribute value. Although it doesn’t show timing, it’s clear to see that there are some dependencies among the various activities.
Value Map
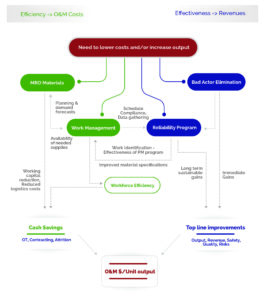 At the bottom line you’ll see “operations and maintenance cost per unit of output”. Ultimately that’s what our consulting customers are looking for – cost-effectiveness. By increasing the margin on sales with reduced costs, and increasing Output / Revenue, we increase profitability.
Other benefits include much better maintenance budget forecast accuracy, budget compliance, and much better forecasting of production volumes and revenues.
Each of the various improvement activities creates value at different times throughout an improvement project’s implementation. Some of the benefit arises fairly quickly, and some much later.
Quantifying benefits can be challenging, especially if the management systems set up for maintenance and operational performance do not link costs to assets and their performance. However, quantification of benefits is possible and the costs to achieve them are fairly easily estimated. Those costs are often a small fraction of the total benefit to be gained, making the improvement initiative self-financing, often within the first year.
Recently we developed a business case for an improvement initiative across six operational locations. Aggregated savings due to efficiency gains were nearly $100 million per year and aggregated production gains due to the effectiveness of reliability programs were worth nearly $1 billion a year. In combination, those benefits were roughly the equivalent of an entirely new production operation. The investment required to get there was less than $20 million, spread over a two to three-year period.
What does your business case look like?
